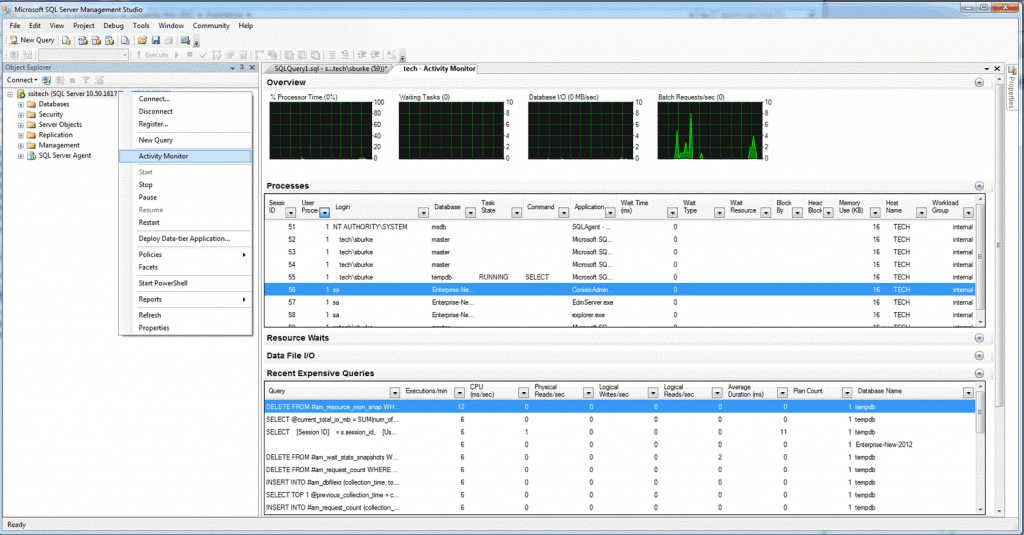
START -> All Programs -> Microsoft SQL Server 2008 R2 -> SQL Server Management Studio
Connect as normal and right-click on the SQL Server (top left) and go “Activity Monitor”.
The Activity Monitor will show the queries been run, the user, the computer been run from etc. This can help narrow down clients chewing up the SQL Database and/or show the databases and queries causing the most issues.
You can also right-click on a Process listed (by a user/computer) and go “Kill Process” to end the SQL client connection (useful if you want to force a user to logout of sql to free up a client license etc.).

————————————————–
Problem:
When I tried to launch the Activity Monitor on a Windows 7 x64 client, I got the error below:
The Activity Monitor is unable to execute queries against Server. Activity Monitor for this instance will be placed into a paused state.
Unable to  find SQL Server process ID on server (Microsoft.SqlServer.Management.ResourceMonitoring)
Solution:
cd \windows\system32
lodctr /R
Ref (#).
Alternative to Activity Monitor
Run the following queries:
#Stored Procedure for showing who is connected.
sp_who2;

#In the SPID column you can see the Session ID of the User. You can go kill spidno to kill that query.
kill SPIDNo.

#Stored Procedure for showing locks.
sp_lock;
Ref (#).
